Energy Company
YPF is the main energy company in Argentina, with a leadership position in the entire oil and gas value chain in the country [production, refining and sale of fuels]. It also boasts a growing business in electricity generation and renewables, as well as a company focused on innovation and new energies.

Commitment to Sustainability
We understand Sustainability, in its triple dimension, economic, environmental and social, as a way of carrying out operations that creates value for shareholders, other stakeholders and for the country.
Sustainability priorities are incorporated into the business strategy to conduct responsible operations that strengthen the company's long-term competitiveness.
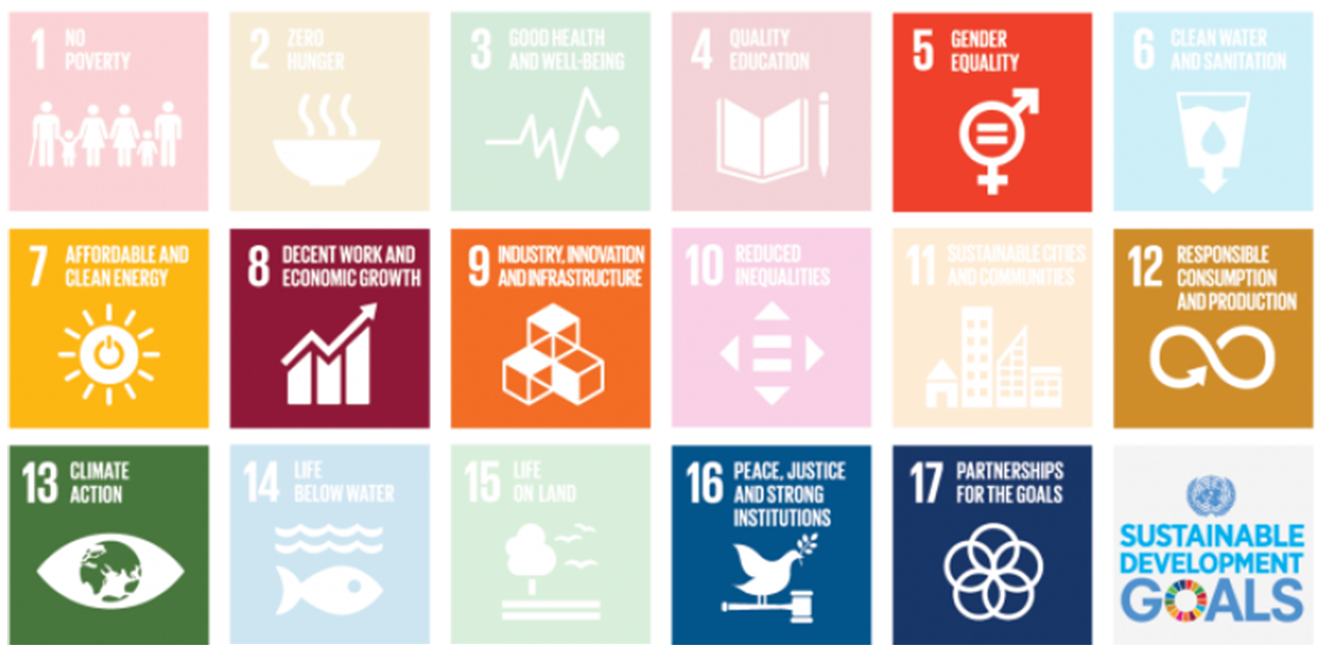
PRIORITIZED SDGs
YPF's sustainability strategy also seeks to contribute to the achievement of the Sustainable Development Goals set forth in the United Nations 2030 Agenda.
It adheres to the 17 SDGs and as an energy company, specifically contributes to goals 7, 8, 9, 12 and 13. We also work to make progress regarding SDGs 5, 16 and 17.

Evaluación Global de Sostenibilidad Corporativa de S&P

We are part of global initiatives such as the Global Compact, EITI and the B20 Energy Task Force. We voluntarily carry out the ESG Assessment designed for the Dow Jones Sustainability Index.
In 2022 we reached 75/100, the best result since we were part of that assessment. In April 2023, our company was ranked in the 98th percentile of the Oil and GAS sector in the S&P Global Corporate Sustainability Assessment.
Governance, Ethics and Integrity
Board of Directors
11 Members
6 Independent members
1 Woman
Investors

Ethics and compliance
Risk management
100% of businesses with mapped corruption risks
Ethics and code of conduct
100% directors and personnel adhered
Complaint channels
for members of the organization and third-parties
Conflict of interests policy
for directors and personnel
Third-party employment program
classification of suppliers based on integrity risks
Due diligence in human rights
human rights risk mapping carried out and 100% security personnel trained
Economic Performance
Operations
29.1%
Participación en el Mercado
de Gas Argentino
514 K BOE/D
Total hydrocarbon production
+2% VS. 2022
236 K BOE/D
Net shale production
+16% VS. 2022
#1 petrochemical producer in the country
1.695 MT/ capacity production year
328 K BBL/D
Refining capacity
+50% Argentine market
1,679
Gas stations
1.072 M BOE
Total proven reserves
+9,6% VS. 2022
US$ 605.4 M
Inversiones de capital y gastos operativos vinculados a integridad y ambiente
68,765
People employed
(direct and contractors)
Financial and economic results
* In argentinian pesos
5,484,544 M
Sales revenue
+117% VS. 2022
-1,532,745 M
Fiscal year result
-628% VS. 2022
1,058,356 M
EBITDA
+71% VS. 2022
7,303,815 M
Net worth
+291% VS. 2022
603,425 M
Tax obligations and other*
Suppliers

5,738
Suppliers with valid qualifications
100% Contracts
Adhering to the code of ethics and conduct
100% High
Criticality suppliers with environmental and safety assessment
Our people
24,613
Direct personnel
44,152
Contractors personnel
Diversity
22.3%
Female employees
+2,6% VS. 2022
19.8%
Leadership positions held by women
+9% VS. 2022
Inclusion and employability
210
Students in internships and professionalizing practices
359,724
Training hours
(does not include hours of occupational safety training)
14.7
Training hours per employee
Health and safety
92%
Personnel with annual medical evaluation performed
0.23
Lost time injury frequency rate (LTIFR)
-29% VS. 2022
Social investment

AR$ 4.937 M
Total social investment
AR$ 4.391 M
Voluntary social investment
AR$ 95 M
Charitable donations
2,2% DE LA ISV


Steam education and sustainable development (Fundación YPF) - five lines of action and impact
52,415
PEOPLE
Capacitadas en programas de Fundación YPF
+64% VS. 2022
Professional technical education
11,275
Participantes en cursos
4,493
Certificados
STEAM Education
330
Becas universitarias en carreras de la energía
60% Mujeres
432
Mujeres capacitadas en programación, diseño web y datos
Renewable energy and energy transition
+15,000
Asistentes al aula móvil
Links with the energy industry
Plan transformar para la energía junto a ministerio educación de Neuquén
Equipamiento a 10 escuelas técnicas - plantas de control, espectrofotómetros, analizadores y notebooks
Simulador de perforación y terminación de pozos para escuela técnica
Local development
Asistencia ténica y donaciones para mejora de espacio público en 4 municipios
Proyectos de desarrollo territorial para 5 municipios
1 plan de manejo de residuos sólidos urbanos
4 murales ecológicos junto a las comunidades
Environmental Performance
Energy use
138,474,944 GJ
Total energy consumption within the organization
-1% VS. 2022
-1,7% VS. 2022 Consumption intensity
2,460,203 GJ
Energy consumption from renewable sources
(purchase to YPF LUZ)
+1% VS. 2022
2,581,971 GJ
(incluyendo GUDI)
55%
Energía eléctrica renovable s/ total comprado a Cammesa (MEM)
-8% VS. 2022 (1)
Este dato representa al % Promedio del año 2023 de Energía eléctrica renovable comprada sobre el total de energía eléctrica adquirida por la compañía, comercializada atravez MEM (Mercado Eléctrico Mayorista). El objetivo compañía es de 50% a 2027. La ley nacional 27.191/15 (decreto reglamentario es 531/16) dispone que la compañía, como sujeto obligado, deberá incorporar como mínimo un 20% del total de consumo propio de energía eléctrica con energía provenientes de fuentes renovables, al 31 de diciembre del 2025. El decreto reglamentario identifica consumo con aquello que se compra en el mercado eléctrico
Emissions
11,259,653 tCO₂e
Emisiones GEI alcance 1+2 YPF
-5% VS. 2022
-37%
Reducción intensidad GEI alcance 1 YPF vs 2017
-7% VS. 2022
12 KgCO₂e/BOE
Emisiones alcance 1+2 Upstream no convencional
-24% VS. 2022
32 KgCO₂e/BOE
Emisiones alcance 1+2 Upstream total (con MdGAS)
-9% VS. 2022
Water use
31,638 MEGALITERS
Consumed water
+15% VS 2022
Intensity 2023 0.62 = 2022
11.9%
Consumo en zona estrés hidrico
+11% VS. 2022
136,706 MEGALITERS
Total produced water and flowback
-0.57% VS. 2022
Waste management
757.2 KT
Total generated waste
579.6 KT
Hazardous waste generated
21%
Waste sent for recovery
635 KT
Total treated waste
Biodiversity protection
100%
Of production sites have environmental impact studies, mitigation plans, and annual monitoring reports
Social Performance